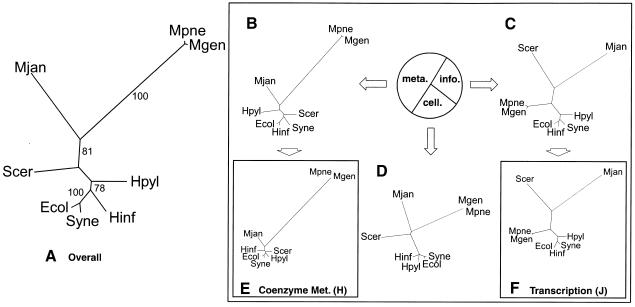
Figure 2.
Genomic trees based on the occurrence of orthologs. (A) Distance-based genomic tree based on the overall occurrence of orthologous proteins in the complete genome. One of the alternative methods we used for phylogenetic analysis involved building trees based on the presence or absence of orthologs in the complete genome, using the information from the original COGs web site with eight genomes (http://www.ncbi.nlm.nih.gov/COG, Tatusov et al. 1999). For each of the microbial organisms, the occurrence of proteins in each of the clusters of orthologous groups was tabulated with 1 for present and 0 for absent. With the parsed data, a distance matrix was then calculated using the normalized Hamming distance, as described in the text. The trees were subsequently constructed using the kitsch program in the PHYLIP package, which allowed for easy automation. For the bootstrap values, we used PAUP. The resulting tree shown is a distance-based tree using the information of the occurrence of all the COGs in the genomes. As expected, the M. pneumoniae and M. genitalium are grouped with bootstrap values of 100%. However, interestingly, E. coli and Synechocystis are also clustered with this bootstrap value—a grouping that is not in the traditional tree. Also, M. jannaschii is clustered with M. pneumoniae and M. genitalium with a bootstrap value of 81%. Furthermore, the eukaryote, S. cerevisiae, is placed among the bacteria. (B, C, and D) Ortholog occurrence genomic trees based on a three-way partition of the whole ortholog set. As described in the text, the total COGs were divided into three large subsets, the information, cellular, and metabolic subsets. The pie chart in Figure 3 shows the number of COGs in each group as percentages. The metabolic subset dominated the total group with 362 COGs, approximately half of all the COGs. The information subset has 190 COGs, just above one quarter, while the cellular subset has 132 COGs, just less than a quarter. For each of the subsets, distance-based trees were generated using the same methods described in A. Because of the smaller sizes of these subsets, the bootstrap values were often ill-defined. The largest subset was the metabolic partition shown in B. There was a high correlation between the trees in A and B. Aside from the different placement of H. pylori and S. cerevisiae, the trees are nearly identical, even having similar branch lengths. The second largest partition was the information subset shown in C. Surprisingly, this subset produced a tree almost identical to the traditional ribosomal tree. The only difference is the switch in the placement of H. pylori and Synechocystis. This shows that although using the entire group of COGs may produce trees much different from the traditional tree, using a smaller subset may in fact produce a tree that is closer to the traditional topology. Part D shows the smallest partition, the cellular subset. (E and F) Representative genomic trees of ortholog occurrence based on specific functional classes J and H. Using the functional classes obtained from the COGs web site, the metabolic, information, and cellular partitions were subdivided further, into specific functional classes. For each of the different functional classes, there was a range of trees produced. Two representatives were chosen to show this variety. Class J (translation, ribosomal structure, and biogenesis), which has 108 clusters of orthologous proteins, is a further subdivision of the information subset. It has a tree very similar to the traditional ribosomal tree in Figure 1A. Class H (Coenzyme metabolism), which has 77 clusters of orthologous proteins, is a further subdivision of the metabolism subset. It produced a tree that did not correspond well to the traditional phylogeny.

