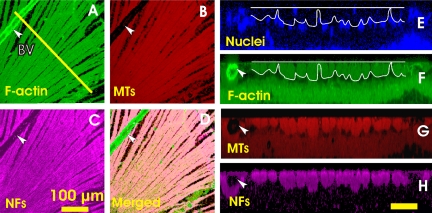
Figure 2.
Cytoskeleton components in normal RNFL with simultaneous fluorescence staining. (A–C) En face images of axonal F-actin, MTs and NFs of the same nerve fiber bundles, at a depth of 6 μm. (D) A composite of images (A), (B), and (C), showing colocalization of the cytoskeleton components. (E–H) CS images of the retina along the line in (A). The line is at a distance of 550 μm from the ONH center. (E) DAPI counterstain shows a single layer of nuclei lying under the RNFL. White lines: RNFL boundaries. (F–H) Normal RNFL appears as a bright, uniformly stained layer near the retinal surface. Arrow and BV: blood vessel. Scale bar: (H) horizontal, 50 μm; and vertical, 25 μm.

