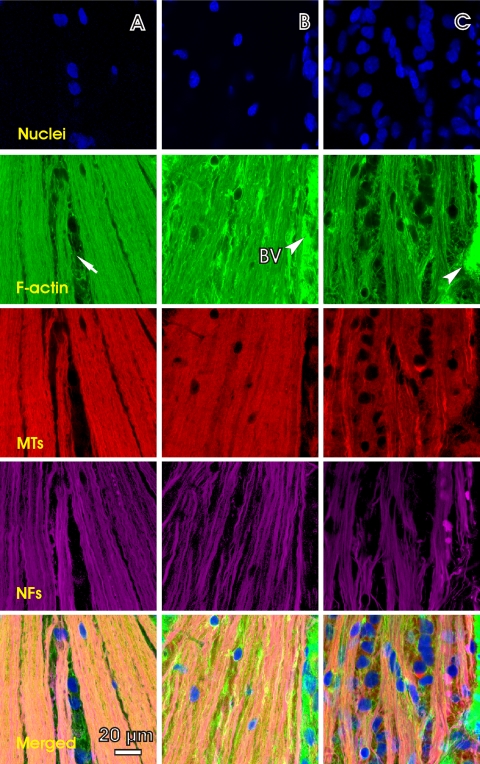
Figure 5.
Distortion of the axonal cytoskeleton in retinas with IOP elevation. All images were at a depth of 5 μm. (A) En face images of a control retina with brightly stained and uniformly distributed cytoskeleton components within the bundles. (B, C) En face images of the retinas with elevated IOP (B, rat 9; C, rat 3 in Table 1). (B) Irregular phalloidin stain appears; bundle boundaries become indiscernible. Strands of NFs are more apparent. (C) More severe irregularity of staining shows in all three cytoskeleton components. Nuclei are abundant and embedded within the bundles. The top of each image is 450 μm from the ONH center. The average RNFL thickness along a horizontal central line (not shown) were 11.5 ± 2.3, 11.8 ± 2.1, and 10.8 ± 3.2 μm for (A), (B), and (C) respectively. Arrow: gap between bundles. Arrowhead and BV: blood vessel.

