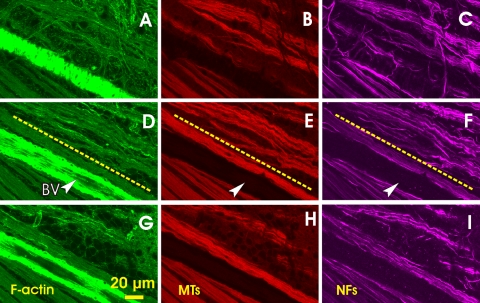
Figure 6.
Different distortion patterns at different depths of the RNFL (rat 2 in Table 1). (A–C) En face images at 1 μm below the RNFL surface. Strands of MTs and NFs within the bundles are apparent. Aberrant strands of F-actin and NFs cross the bundles. (D–F) En face images of the same bundles in (A–C) at 2 μm below the RNFL surface. The images show normal-looking bundles in the bottom left (below the dashed lines) and distorted bundles in the top right. Wavy strands of cytoskeleton components run along the bundles. (G–I) En face images of the same bundles at 10 μm below the RNFL surface. Bundles have started to disappear. Arrowhead and BV: blood vessel.

