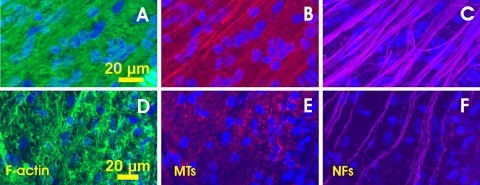
Figure 7.
Distortion pattern of cytoskeleton in severely damaged retinal regions (A–C: rat 2 and D–F: rat 10 in Table 1). (A–C) Bundle traces were still perceptible with the F-actin and MT staining but the strand patterns of the F-actin and MTs appear different from that in the NF image. Images were 2 μm below the RNFL surface. The average thickness of the RNFL was 4 μm. (D–F) A retinal region with total loss of the RNFL. There were no apparent strands of F-actin and MTs. A few strands of NFs ran along the bundle direction, inferred from the position of the ONH.

