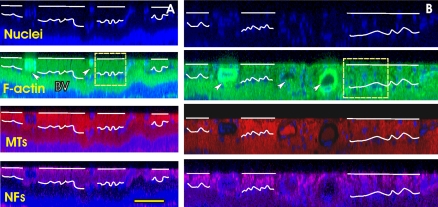
Figure 8.
Distortion of cytoskeleton before the change in RNFL thickness (rat 6 in Table 1). (A) CS images of the control retina showing uniformly stained bundles in all three cytoskeletal images. White curves: the boundaries of the RNFL lacking of nuclei. (B) CS images of the fellow treated retina without thinning of the RNFL. The stain looks nonuniform. Both sections were taken in the caudal–ventral regions at a distance of 250 μm from the ONH center. Arrow and BV: blood vessel. The scale bars: (A, B) horizontal, 100 μm; vertical, 50 μm.

