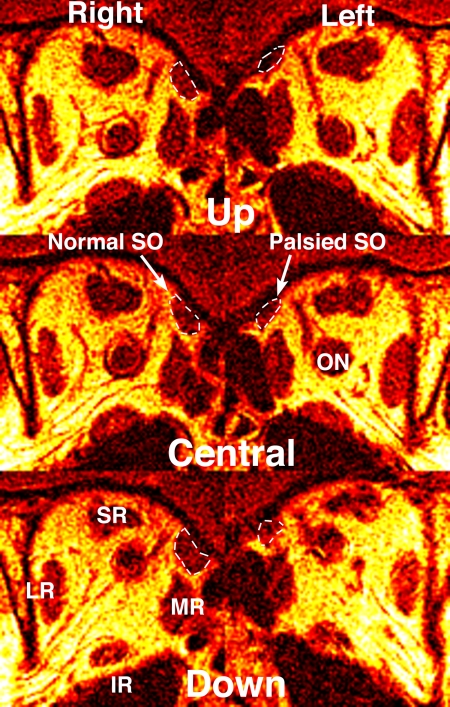
Figure 3.
Quasi-coronal MRI in midorbit of the subject with left SO palsy illustrated in Figures 1 and 2. The cross section of the normal right SO is larger than that of the palsied left SO in central gaze, and the cross section of the right but not the left SO increases from up to down gaze. This represents neurogenic atrophy of the left SO. Abbreviations as in Figures 1 and 2.

