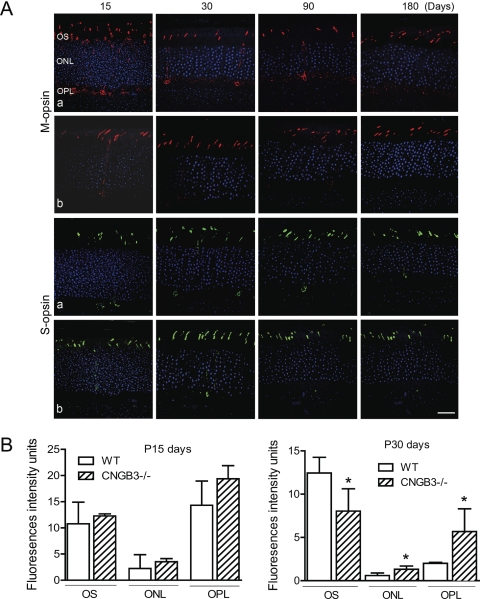
Figure 6.
Mislocalization of cone opsin in CNGB3−/− mice. Immunofluorescence labeling of cone opsin was performed on retinal cross-sections prepared from CNGB3−/− and WT mice at P15, P30, P90, and P180. (A) Shown are the representative confocal images of M-opsin and S-opsin labeling on the retinal sections prepared from CNGB3−/− (a) and WT (b) mice. OS, outer segment; ONL, outer nuclear layer; OPL, outer plexiform layer. Scale bar, 100 μm. (B) Quantitative analysis of the fluorescence intensities of M-opsin labeling in the OS, ONL, and OPL regions. Data represent mean ± SD (n = 4 mice for each group). Unpaired Student's t-test was used to determine significance (*P < 0.05).

