Figure 2.
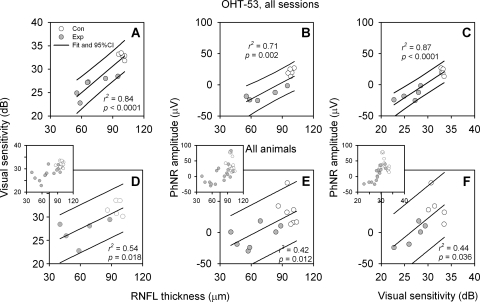
Relations between average RNFLT, VS, and PhNR amplitudes (measured for the response to a flash of 2.84 cd · s/m2). (A–C) Data from multiple imaging and recording sessions for subject OHT-53 only; (D–F) data from the last session of each animal (main panels) and all sessions of all animals (insets). Open circles: data from control (Con) eyes; gray circles: data from fellow Exp eyes. Solid lines: linear fits and 95% PI for data from both eyes. There were only five PhNR recordings available for each eye of subject OHT-53, as indicated in Table 1.

