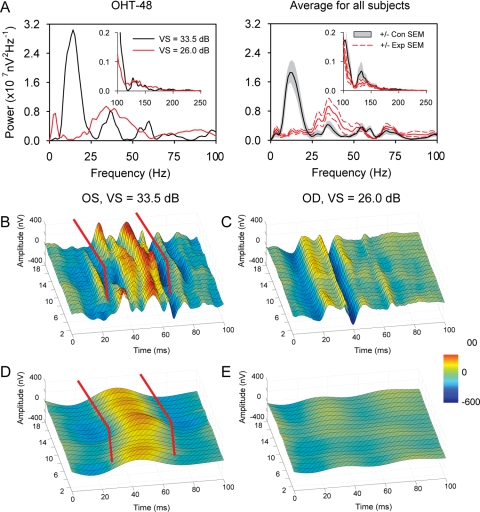
Figure 4.
Effects of experimental glaucoma on mfERG signals. (A) Left: power spectra of the summed mfERG recordings from each eye of subject OHT-48; right: LL subjects with unilateral glaucoma. The red lines for Con eyes and the gray shading for the Exp eye indicate ±1 SEM. Insets: frequency range of high-frequency OPs. (B) 3D surface plot for the third-ring responses from the Con eye of OHT-48. (C) 3D surface plot for the third-ring responses from the Exp eye of OHT-48. (D, E) 3D surface plots for third-ring LFCs obtained by passing responses in (B) and (C) through a 25-Hz low-pass filter. The red lines in (B) and (D) are drawn parallel to the linear fits of P1 implicit time of the ONHCs (not shown).

