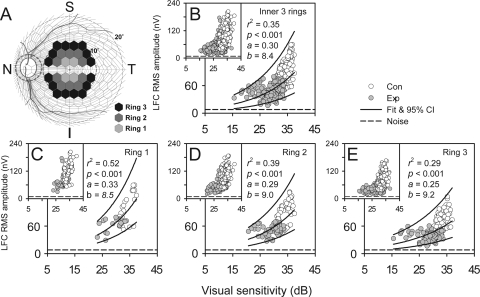
Figure 8.
Relation between local LFC RMS amplitude and VS revealed with the data from the last experimental sessions (main panels) and all sessions (insets) of all the animals. (A) Data in the hexagons were from the three central rings of the global flash mfERG. (B) Data from all three rings and an exponential fit: LFC RMS amplitude = exp[a(total deviation in dB)] + b). (C–E) Data from the each of the three rings plotted separately. Solid lines: represent exponential fits and 95% PI for data from both Con and Exp eyes.

