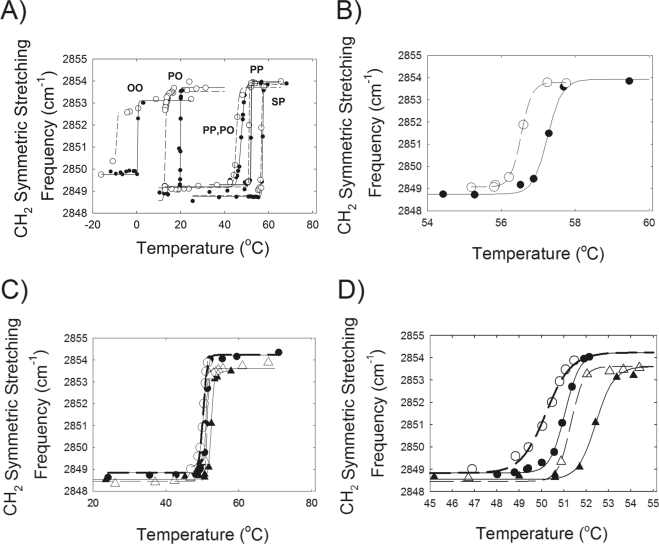
Figure 5.
(A) Wax phase transition curves for OO oleyloleate, PO palmityloleate, PP palmitylpalmitate, SP sterylpalmitate. (●) Heating curve; (○) cooling curve. Lines are the fit of the data to equation 1 in Borchman et al.36 The lower the CH2 symmetric stretching frequency, the more ordered the wax hydrocarbon chains. (B) Melting curve for sterylpalmitate. The scale is enlarged from (A) so that hysteresis between the cooling (○) and heating (●) curves can be observed. (C) Equal molar mixture of sterylpalmitate and oleyloleate (●) heating and (○) cooling curve. Sterylpalmitate:oleyloleate:cholesterylpalmitate 2:2:1 (m:m:m) where m is moles. (▴) heating curve, (▵) cooling curve. (D) Enlargement of the scale in (C).

