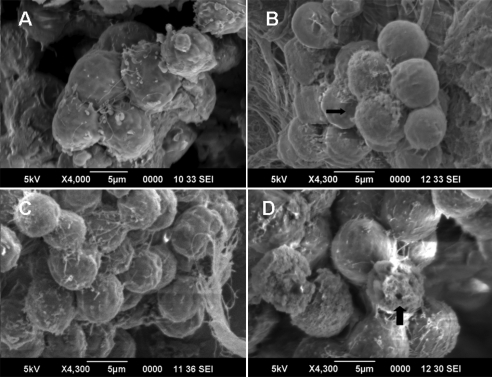
Figure 5.
SEM of cells. (A) t = 0, control cells not exposed to ultrasound. (B) t = 10, cells exposed to 10 seconds of 0.3 W/cm2 ultrasound and microbubbles (US + MB). No pores were visible. (C) t = 13, photographs taken 3 seconds after ultrasound was stopped. No pores were identified. (D) t = 60, cells exposed to 60 seconds of 0.3 W/cm2 US + MB. Pores (arrow) were identified in cells after 60 seconds of US + MB exposure.

