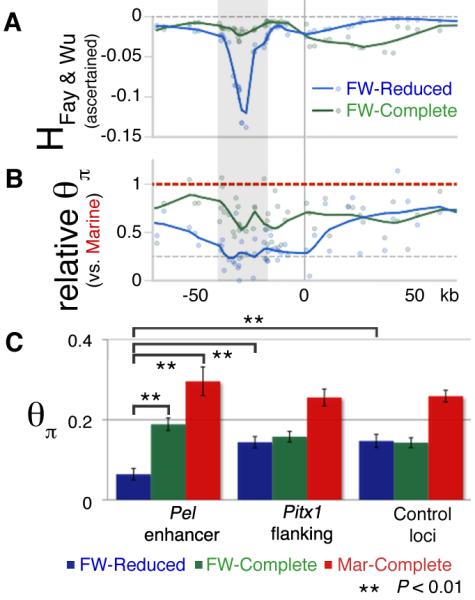
Fig. 5.

(A and B) Fay and Wu’s H and relative heterozygosity (θπ) statistics across the Pitx1 region. Blue (freshwater pelvic-reduced) and green (freshwater pelvic-complete) data points and LOESS smoothed (α=0.2) line indicates the behavior in each group. The Pel-containing regulatory region of Pitx1 (grey candidate region from Fig. S1B) shows both negative H values, indicating an excess of derived alleles; and reduced heterozygosity in pelvic-reduced fish, consistent with positive selection (see text). θπ values are plotted relative to the grouped marine mean (per SNP) to control for variation in ascertainment between SNPs. (C) Heterozygosity (θπ) from different genomic regions, grouped by population type. Freshwater fish show a general decrease in heterozygosity across both Pitx1 and control loci compared to marine fish (red bars), as expected from founding of new freshwater populations from marine ancestors. In the Pel enhancer region, but not in Pitx1-flanking regions, or in control loci, pelvic-reduced freshwater populations (blue bars) show even lower heterozygosity than pelvic-complete freshwater populations (green bars) (**, P < 0.01).
