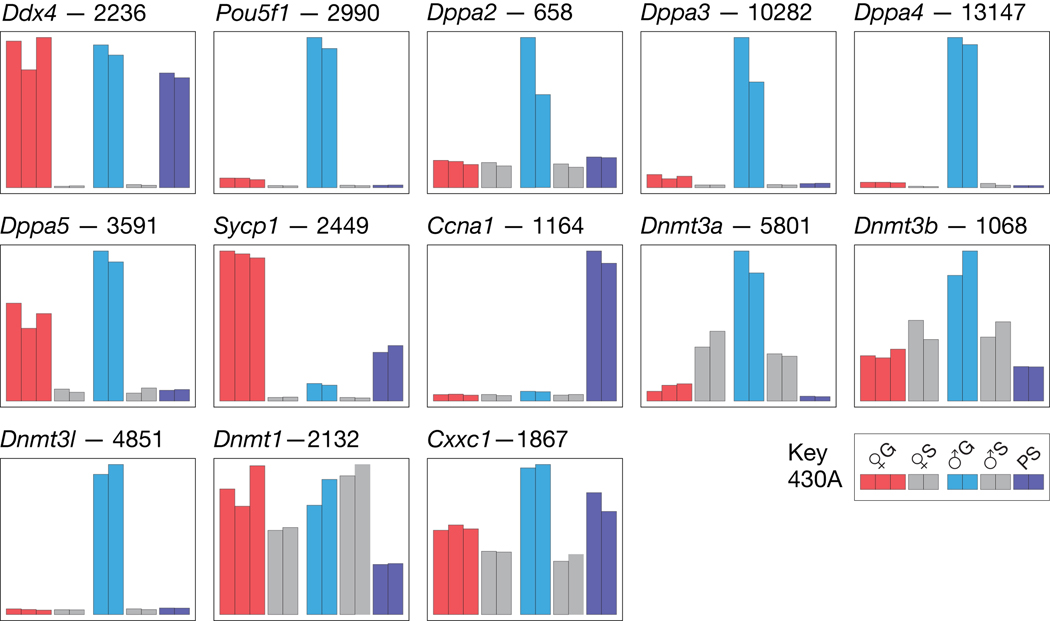
Fig. 1.
Relative expression of germ cell marker genes. At the top left of each histogram is given the gene symbol followed by the intensity value for the sample showing the highest relative level of expression. Key: ♀G, 15½ dpc female germ cells (oogonia, at meiosis I, pachytene); ♀S, 15½ dpc female gonadal somatic cells; ♂G, 15½ dpc male germ cells (prospermatogonia, in mitotic arrest); ♂S, 15½ dpc male gonadal somatic cells; PS, adult spermatocytes (at meiosis I, pachytene). All 13 genes are on the 430A chip. Probes sets corresponding to the histograms: Ddx4, 1427242_at; Pou5f1, 1417945_at; Dppa2, 1429654_at; Dppa3, 1424295_at; Dppa4, 1429597_at; Dppa5, 1416552_at; Sycp1, 1427291_at; Ccna1, 1449177_at; Dnmt3a, 1423066_at; Dnmt3b, 1418351_a_at; Dnmt3l, 1425035_s_at; Dnmt1, 1435122_x_at; Cxxc1, 1452221_a_at. When the expression of a gene is represented by multiple probe sets, only the probe set giving the highest intensity values was used to generate the histogram.

