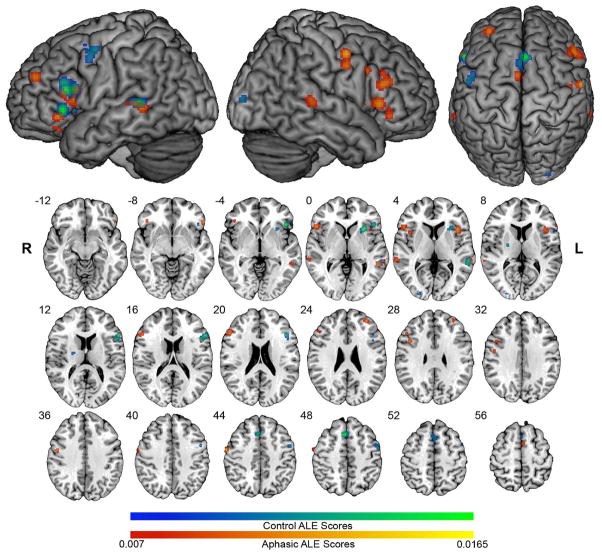
Figure 1.
We submitted activation foci from fMRI and PET studies using the same language tasks on both aphasic patients and control subjects to Activation Likelihood Estimation (ALE) analysis. Control ALE clusters are in blue-green scale, and show left hemisphere language and motor activity. Aphasic ALE clusters are in red-yellow scale, and show bilateral activations with right hemisphere areas that are homotopic to control ALE clusters. ALE maps are overlaid on the standard Colin brain in MNI space, using an FDR q = .01 critical threshold, and minimum cluster size of 100 mm3. (Reproduced with permission from Turkeltaub et al., submitted)

