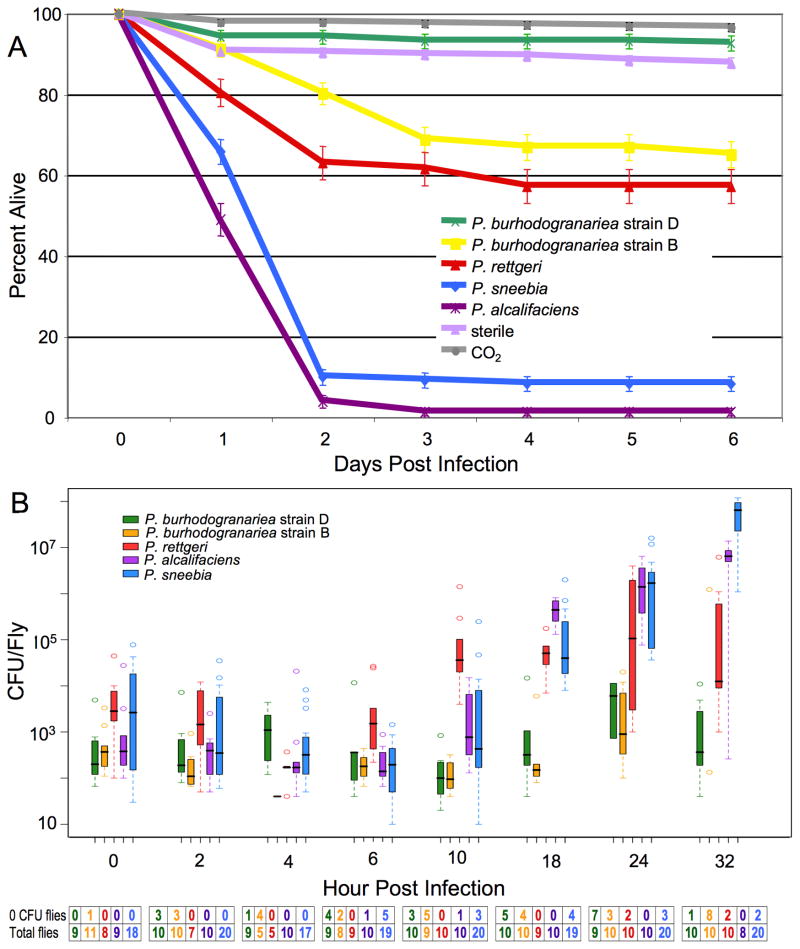
Figure 1.
Mortality of and bacterial proliferation in D. melanogaster. (A) Mortality of D. melanogaster from Providencia Infection. Wild type D. melanogaster were infected through pinprick infections with different strains of Providencia. All treatments result in highly significant differences in mortality (all pairwise contrasts p < 0.0001), except the difference between sterile needle and CO2 controls, between infection with P. burhodogranariea strain D and either control, and between P. rettgeri and P. burhodogranariea strain B (in all cases p > 0.0025, the Bonferroni corrected cut off value). (B) Providencia Bacterial Load in D. melanogaster. Boxplot of the number of CFU present in D. melanogaster during the first 32 hours post infection. Note that the y-axis is a log scale. Whiskers approximate two times the standard deviation. The table under the graph has the number of flies that had no CFU at each time point for each treatment, as well as the total infected flies per treatment at each time point. Flies with no CFU present were not included in the boxplot. Sterilely wounded control flies never had any CFU at any time point.

