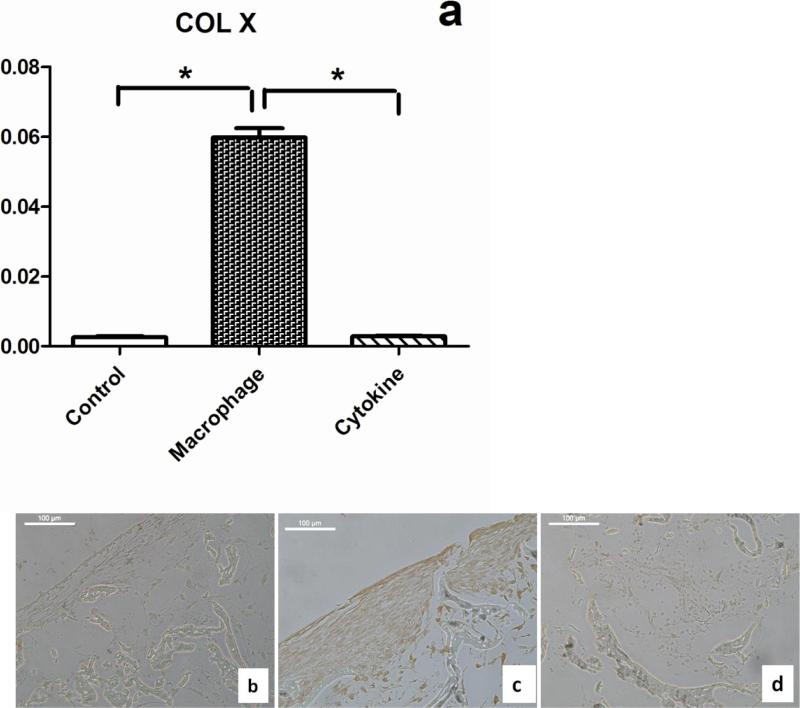
Figure 6.
Hypertrophy markers in chondrocytes. (a) Transcript level of collagen X in no stimulation group (control) macrophage conditioned medium treated group (Macrophage) and cytokines stimulation groups (Cytokines) after 1 week treatment. *Significant differences between groups at p<0.05. (b) Collagen X immunohistology staining of cross-sections of the cartilage with the different stimulation conditions, (b) Control group without stimulation, (c) with MCM stimulation, and (d) with cytokines stimulation. Scale bars, 100 um

