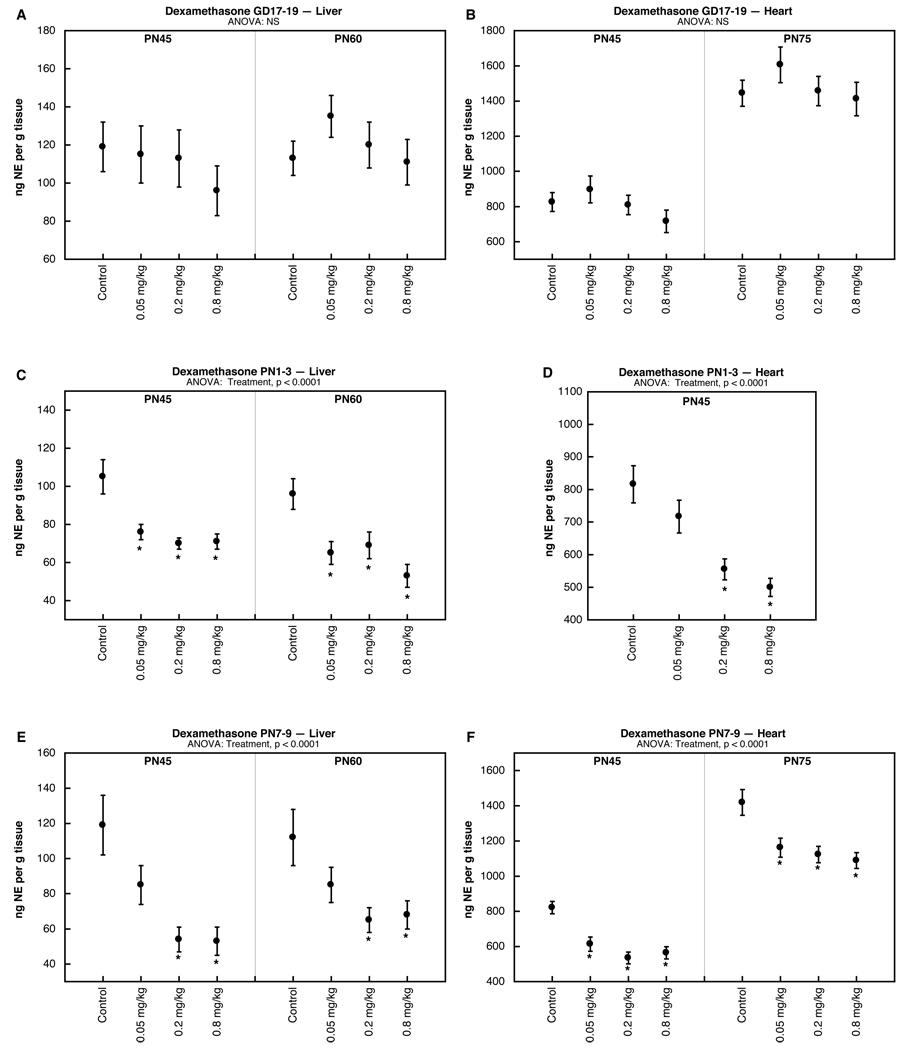
Figure 1.
Effects of dexamethasone administered on GD 17–19 (A,B), PN1-3 (C,D) or PN7-9 (E,F), assessed in liver (A,C,E) and heart (B,D,F). Data represent means and standard errors obtained from 12 animals in each treatment group at each age; results from males and females were combined because of the absence of treatment × sex interactions. ANOVA appears at the top of each panel and asterisks denote individual treatment groups that differ significantly from the corresponding control group.

