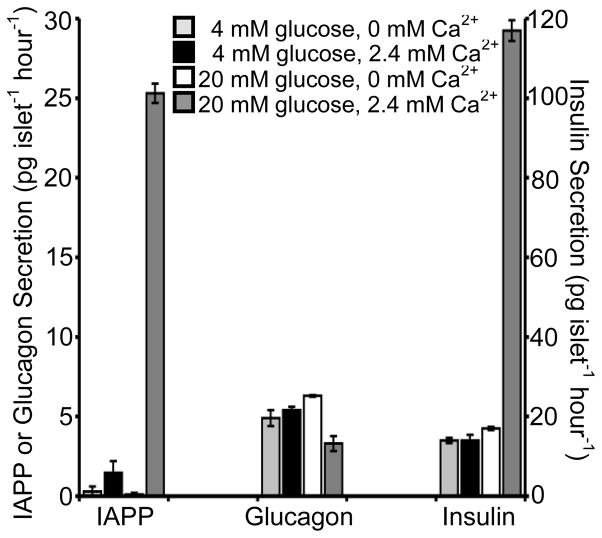
Figure 4. Ca2+-dependence of IAPP, glucagon, and insulin secretion.
Insulin, IAPP, and glucagon secretion was measured from 15 islets in 4 mM glucose with 0 mM extracellular Ca2+ (light grey bars), 4 mM glucose with 2.4 mM extracellular Ca2+ (black bars), 20 mM glucose with 0 mM extracellular Ca2+ (white bars), and 20 mM glucose with 2.4 mM extracellular Ca2+ (dark grey bars). Average values of four replicate experiments are given with the error bars corresponding to +/− 1 standard error of the mean. IAPP and glucagon values are shown on the left y-axis and insulin values are shown on the right y-axis.

