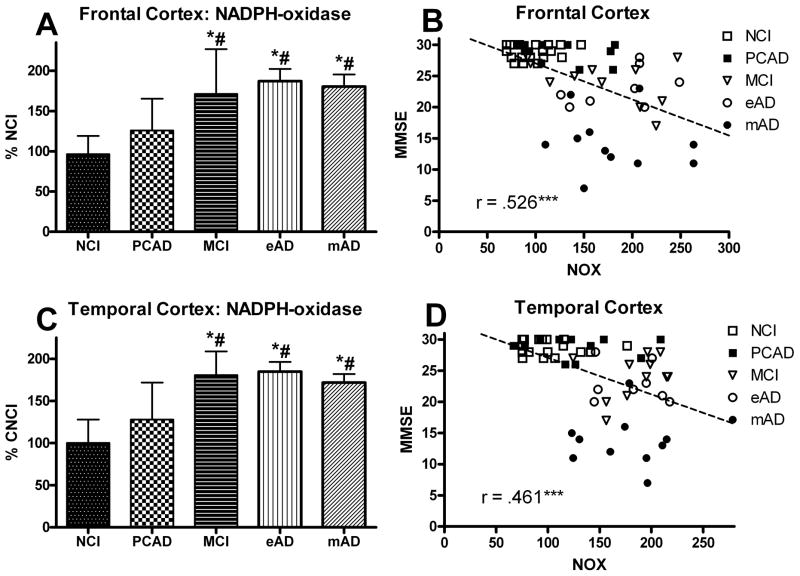
FIG. 1.
Levels of NADPH-oxidase (NOX) activity analyzed in human (A) frontal and (C) temporal cortex from individuals classified as NCI, PCAD, MCI, eAD, and mAD. Bars represent group mean ± SD. *p < 0.01 versus NCI, #p < 0.01 versus PCAD. Scatter plots show the association between NOX activity and the subject’s score on the Mini Mental Status Exam (B) FC and (D) TC. Line used to represent the direction of the association and does not indicate a line of regression. *** p < 0.001 Spearman’s rho. In both FC and TC, individuals with increased NADPH-oxidase activity had lower MMSE scores.

