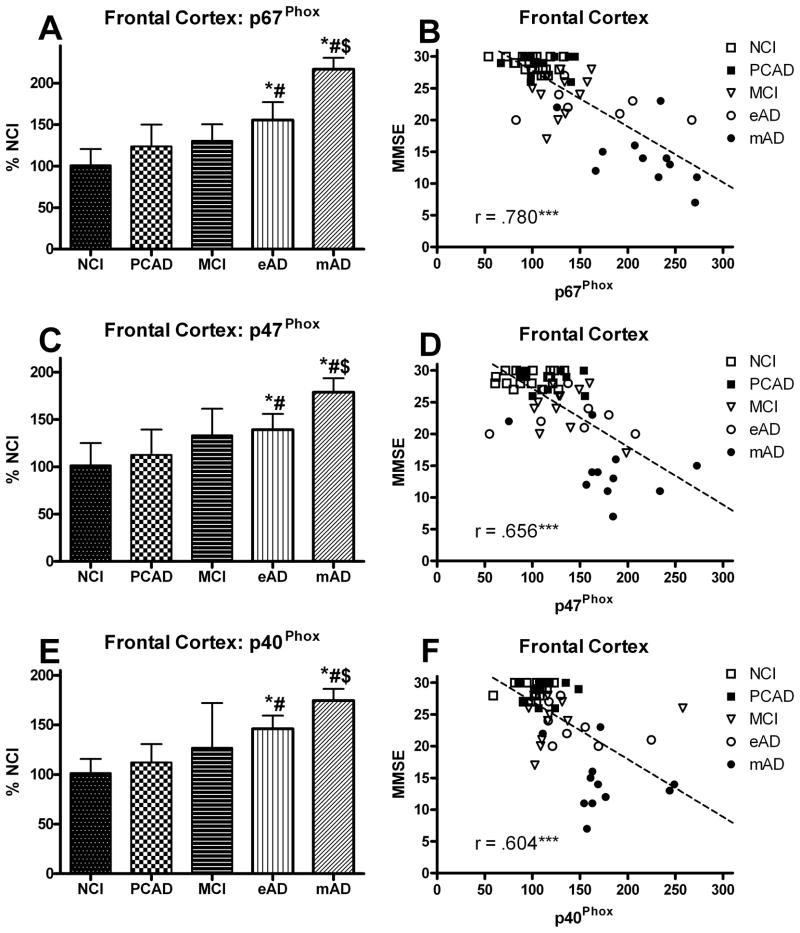
FIG. 3.
Levels of cytosolic protein subunits of NADPH-oxidase (p67Phox, p47Phox, p40Phox) (A,C,E) analyzed in membrane fractions of the frontal cortex from individuals classified as NCI, PCAD, MCI, eAD, and mAD. Values are plotted as percent change from the levels observed in the NCI cohort. Bars represent group mean ± SD. *p < 0.01 versus NCI, #p < 0.01 versus PCAD, $ p < 0.01 versus MCI. Scatter plots show the relationship between the individual’s score on the MMSE and the levels of the different cytosolic subunits (B,D,E). Each point represents an individual subject. Line used to represent the direction of the association and does not indicate a line of regression. *** p < 0.001 Spearman’s rho

