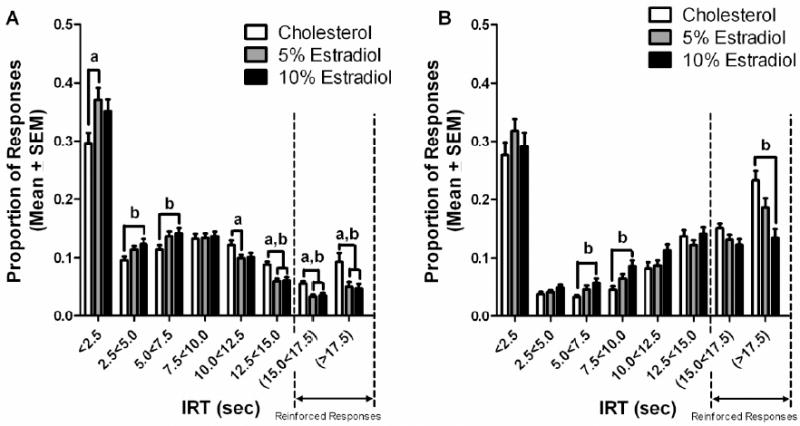
Figure 3.

(A) Proportion of total responses in each 2.5 sec inter-response time (IRT) bin during the initial 6 testing sessions for treatment dose. The cholesterol group made more responses during the 12.5<15.0 sec, 15.0<17.5 sec, and >17.5 sec bins than both the 5% and 10% estradiol groups (a,bp<0.05). The 5% estradiol group made more responses than the cholesterol group during the <2.5 sec bin, while making fewer responses than the cholesterol group in the 10.0<12.5 sec IRT bin(ap<0.05). The 10% estradiol group made more responses during the 2.5<5.0 and 5.0<7.5 IRT bins than the cholesterol group bp<0.05). (B) Proportion of total responses in each 2.5 sec IRT bin during the final 6 testing sessions for treatment dose. The cholesterol group made fewer responses than the 10% estradiol group in the 5.0<7.5 sec and 7.5<10.0 sec bins, while making more responses in the >17.5 sec IRT bin (bp<0.05).
