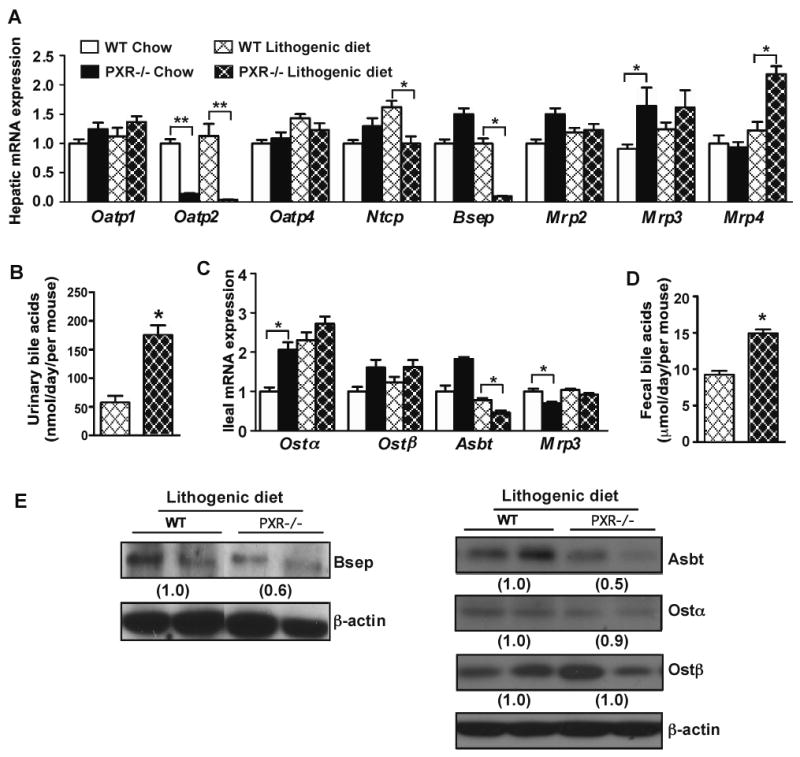
Figure 3. Loss of PXR altered the basal and lithogenic diet responsive expression of bile acid transporters.

(A) Hepatic mRNA expression of bile acid transporters as measured by real-time PCR. (B) Urinary levels of bile acids. (C) Ileal mRNA expression of bile acid transporters. (D) Fecal output of bile acids. N=7 for each group. * P<0.05; **P<0.01. (E) Expression of hepatic (left panel) and ileal (right panel) bile acid transporter proteins was measured by Western blot analysis. The relative average protein level was determined by densitometry and labeled underneath the bands.
