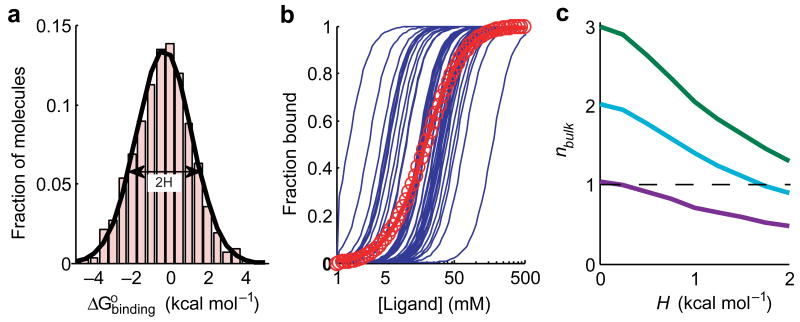
Figure 1.
Simulations of ligand binding cooperativity with a heterogeneous population of molecules. (a) A simulated distribution of ligand binding energies, , for 3000 hypothetical molecules. The standard deviation of the distribution, referred to as the heterogeneity parameter, H, is 1.5 kcal mol-1. (b) Simulated ligand binding curves for individual molecules with the cooperativity coefficient n = 3 (blue lines). Fifty randomly drawn curves are displayed. The bulk binding curve is the sum of curves of all of the molecules (red circles). The red line is the best Hill fit to the bulk binding curve, giving nbulk = 1.6. (c) Reduction of the bulk cooperativity parameter nbulk as a function of the heterogeneity parameter H for three different true values of n. The dashed line at nbulk = 1 separates positive and negative observed cooperativity.

