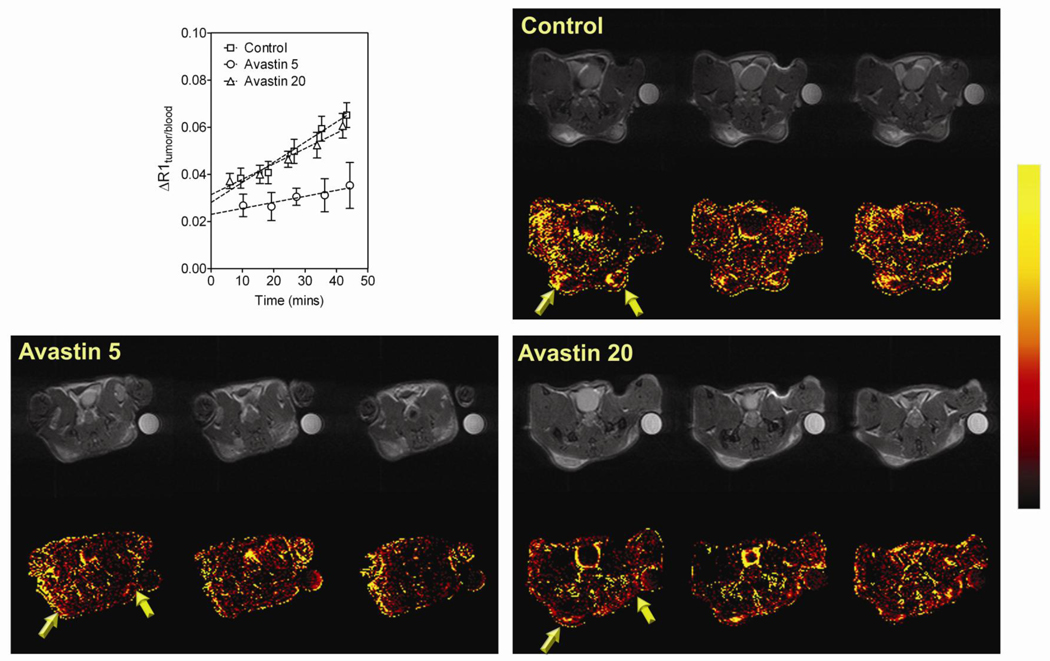
Figure 1. MRI-based assessment of antiangiogenic activity of Bevacizumab against HNSCC.
Plot shows the normalized change in T1-relaxation rate (ΔR1 tumor/blood) of control FaDu tumors (n=5) and Bevacizumab-treated FaDu tumors at 5 mg/kg (Bevacizumab 5, n=6) or 20 mg/kg (Bevacizumab 20, n=5) over ~45 minutes following administration of the MR contrast agent. Linear regression analysis of normalized ΔR1 (tumor/blood) was performed to estimate tumor vascular volume (y-intercept) and permeability (slope). Panel of images represent permeability maps of individual mice bearing FaDu tumors (3 contiguous slices) from each of the 3 groups (Control, Bevacizumab 5 mg/kg and Bevacizumab 20 mg/kg) along with corresponding raw proton images. A color look-up table was applied to the calculated permeability maps to allowed improved visualization of treatment-induced changes in vascular permeability.

