Figure 7.
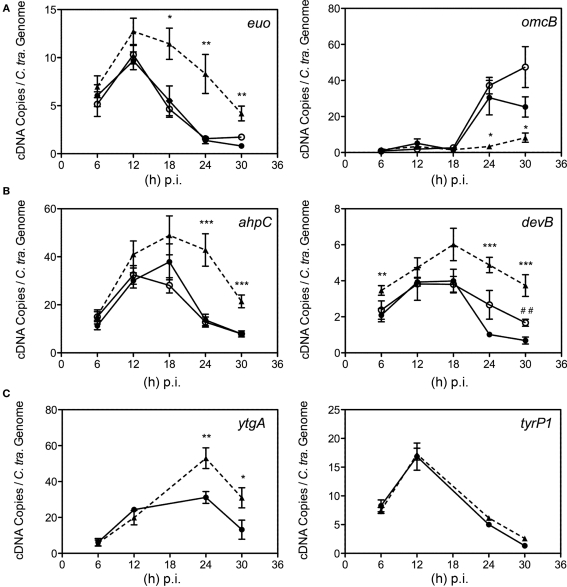
Time course analysis of selected transcript expression of C. trachomatis. Samples were cultured in normal iron-replete medium (--•--), or in conjunction with deferoxamine (--○--) or bipyridyl (--Δ--). Total RNA was extracted longitudinally and reverse transcribed to cDNA for quantification using specific primer sets (Table 1). cDNA levels were adjusted to reflect the number of chlamydial organisms by using the number of chlamydial genomes determined from parallel samples. (A) Transcripts whose expression were altered under multiple models of persistence (Iliffe-Lee and McClarty, 2000; Belland et al., 2003; Ouellette et al., 2006; Timms et al., 2009). (B) Transcripts from C. trachomatis whose expression were altered under iron-restriction. (C) ytgA, a transcript whose expression was hypothesized to be responsive to fluctuations in iron availability, along with tyrP1 whose transcription was altered under IFN-g treatment, but not iron-restriction in C. pneumoniae (Timms et al., 2009). Statistical significance relative to the untreated control was determined using two-tailed t-test (Bpdl-treated samples: *p < 0.05, **p < 0.01, ***p < 0.001; DFO-treated samples: ##p < 0.01).

