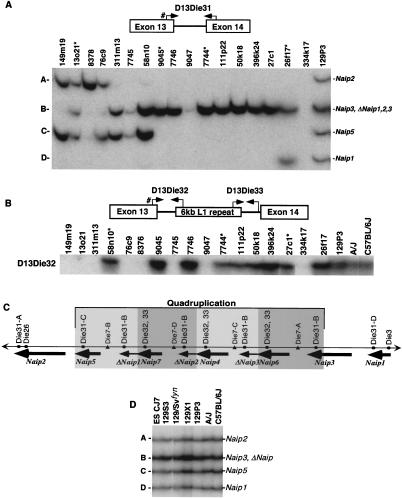
Figure 1.
Intron 13 identifies conserved Naip elements. (A) Autoradiography of 6% denaturing polyacrylamide gel of PCR products amplified from the indicated 129 mouse Lgn1 BACs using STS D13Die31 (see Methods). A schematic of D13Die31 is indicated to show primer orientation. Pound sign indicates common primer with D13Die32. Band sizes are labeled A–D from largest to smallest. Asterisk indicates nonoverlapping clones in 129 physical map of the Naip array that contain D13Die31-B, indicating four distinct D13Die31-B loci. (B) Autoradiography of 6% denaturing polyacrylamide gel of PCR products amplified from the indicated 129 mouse Lgn1 BACs using STS D13Die32 (see Methods). A schematic of D13Die32 and D13Die33 is indicated to show primer orientation. Pound sign indicates common primer with D13Die31. Asterisk indicates nonoverlapping clones in 129 physical map of the Naip array that contain D13Die32, indicating three distinct D13Die32 loci. Identical patterns of amplification were obtained with D13Die32 (data not shown). (C) Schematic of the structure of the Naip array in mice of the 129 haplotype. Single-copy markers D13Die26 and D13Die3 are indicated, identifying “unique” Naip loci. The four copies of the repeated marker D13Die7 are indicated. Gray shading indicates four subunits of the quadruplication of Naip sequence. Positions of Naip intron 13 loci identified with D13Die31, D13Die32 and D13Die33 are shown. (D) Autoradiography of 6% denaturing polyacrylamide gel of PCR products amplified with D13Die31 on genomic DNA from cell line ES CJ7 and several inbred mouse lines. Band sizes are labeled as in A. Identification of Naip loci are as determined from 129 physical map (Growney et al. 2000).

