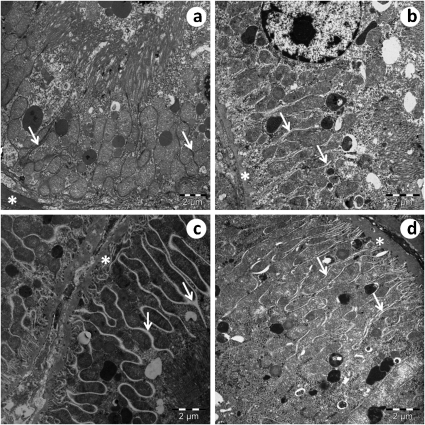
Figure 3.
An electron micrograph of a convoluted proximal tubule. In the SED-SHR (c), there is an increase in the space between the interdigitations (arrow), and the basal membrane (*) of the tubules exhibit a thickened appearance compared to the EX-SHR (d) and the SED-WKY (a) and EX-WKY (b) control groups.

