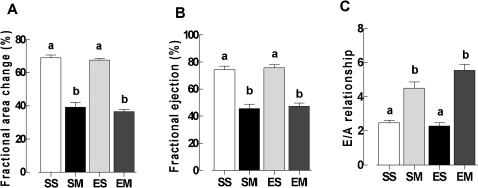
Figure 3.
The echocardiographic values are expressed as the mean ± SEM for the sedentary sham (SS), sedentary infarcted (SMI), exercised sham (ES) and exercised infarcted (EMI) groups. Panel A: The fractional area change. Panel B: The fractional ejection. Panel C: The E/A relationship. The different letters represent statistical significant differences (P<0.05) in a two-way ANOVA model followed by Tukey's post-hoc test.

