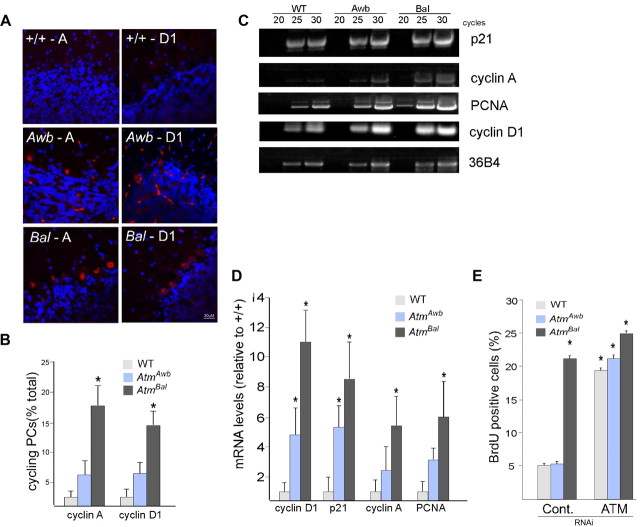
Figure 2.
Cell cycle reentry found in Atm mouse cerebellum. A, Images of mouse brain sections immunostained with anti-cyclin A and anti-cyclin D1 antibodies (red). Nuclei were counterstained with DAPI (blue). Genotypes and antibodies as indicated on the panel. A, Cyclin A; D1, cyclin D1. B, Immunostained Purkinje cells were counted in material similar to that shown in A. Results were expressed as a percentage of the total of calbindin-immunopositive cells. C, Cerebella from 3-month-old Atm+/+, Atmtm1Awb, and Atmtm1Bal mice were subjected to total RNA extraction, reverse transcription, and PCR amplification as described. Representative blots of the amplified PCR fragments of various cell-cycle genes from wild-type, Atmtm1Awb, and Atmtm1Bal mice cerebella at 20, 25, and 30 cycles of are shown. D, Quantifications of RT-PCR products from 3–5 animals of each genotype are displayed in the histogram. Band quantifications were normalized to 36B4 levels. Data are displayed as average ± SEM fold increase over Atm+/+, with Atm+/+ samples set to 1. p values (*p < 0.05) were calculated from multiple animals by Student's t test. E, E16.5 cortical neurons of the genotypes indicated were cultured for 4–5 d before exposure to either control siRNA (left) or siRNA against ATM. Twenty-four hours later, BrdU was added to the medium to assess cell cycle activity. Values represent the percentage of the total cell population (DAPI counts) that was BrdU immunolabeled. Each bar represents the average of three independent experiments; error bars denote SEM.

