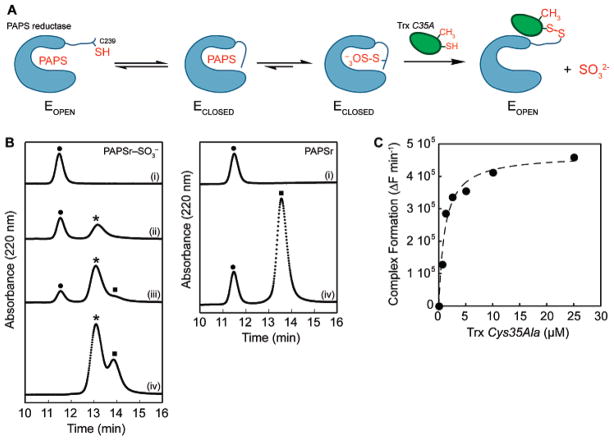
Figure 2.
Formation of the PAPS reductase–Trx1 protein complex. (A) Strategy for trapping the E. coli PAPS reductase–Trx1 protein complex. (B) Complex formation was monitored at 220 nm by reversed phase HPLC analysis and plotted as a function of time. E. coli Trx1 Cys35Ala (10 μM) was incubated with increasing amounts PAPS reductase S-sulfocysteine intermediate [0 (i), 4 (ii), 9 (iii), and 20 μM (iv) at the left] or PAPS reductase alone [0 (i) and 20 μM (iv) at the right]. Mass spectrometry analysis of the observed peaks indicated masses of 13 937.1 Da for Trx1 [(●) 13 937.8 Da, theoretical], 30 007.3 Da for PAPS reductase [(■) 30 007.5 Da, theoretical], and 43 941.8 Da for the PAPS reductase–Trx1 complex [(*) 43 942.4 Da, theoretical]. (C) Rate of formation of the PAPS reductase–Trx1 complex from the PAPS reductase S-sulfocysteine intermediate (1 μM) plotted as a function of Trx Cys35Ala concentration, monitored by SYPRO ruby-stained nonreducing SDS–PAGE gel analysis. The dashed line represents a fit of the data to the equation derived for active site-directed irreversible inhibitors as described in Experimental Procedures and gave an apparent Ki value of 1.1 μM for the PAPS reductase S-sulfocysteine intermediate and Trx1 Cys35Ala.

