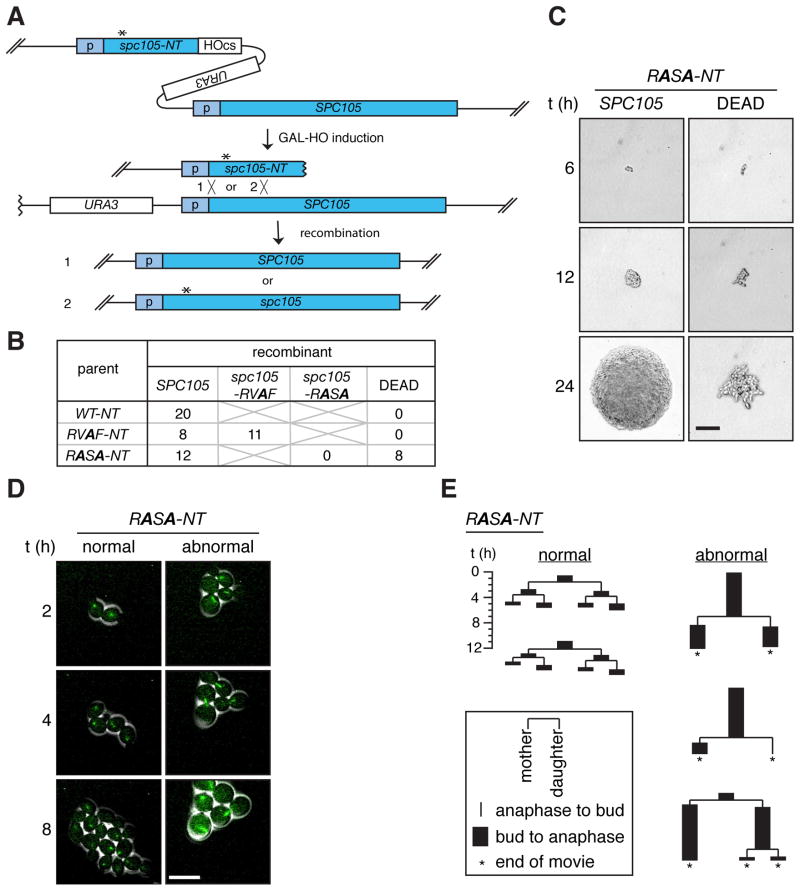
Figure 1. A PP1 binding mutant, spc105-RASA, is lethal with mitotic arrest.
(A) Schematic of the HGR method. Asterisk indicates the desired mutation. Homologous recombination after HO-induced DNA breaks generates full-length wild-type SPC105 (1) or mutant spc105 (2) (B) Single cell colony assay of cells harboring the WT-NT, RVAF-NT, and RASA-NT cassettes. Six hours after GAL-HO induction, single cells were isolated, allowed to grow into isogenic colonies, and genotyped. Number of colonies with the indicated genotypes or those that failed to form macroscopic colonies (DEAD) is shown. (C) Representative colonies of the two classes of recombinants resulting from the RASA-NT cassette were imaged at the times indicated after single cell isolation. The colony on the left harbors wild-type SPC105 as confirmed by genotyping analysis. Scale bar, 50 μm. (D) Time-lapse microscopy of GFP-Tub1 (green) was performed on RASA-NT cells beginning 6 hours after GAL-HO induction. Scale bar, 10 μm. (E) Pedigree analysis of recombinants generated from the cells harboring the RASA-NT cassette during live cell imaging (Movies S2, S3). Each lineage starts from a single unbudded cell and the duration of budding to anaphase (black rectangle) and anaphase to budding (line) were measured for three generations or until the end of the movie (asterisks). At each division, fates of the mother cell and the daughter cell are shown on the left and right, respectively. Representative lineages showing normal cell divisions (left 2 examples) and abnormal cell divisions (right 3 examples) are shown. See also Movies S1–3 and Figure S1.

