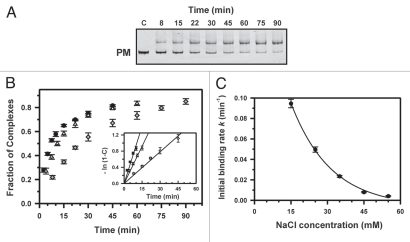
Figure 2.
Kinetics of PNA1 binding to the perfectly matched (PM) sequence. (A) The NcoI-AvrII fragment of plasmid pPM (374 bp) was incubated at 42°C with γ-PNA in the presence of 35 mM Na+ at various times, indicated above each lane. Lane c is a control without PNA. The PNA concentration was 1.5 µM and the dsDNA concentration was 6 nM. (B) Plots of fraction of complexes as a function of the time of incubation at 15 (circles), 25 (triangles) or 35 mM Na+ (diamonds). Inset: Semilogarithmic plots of the kinetics of strand invasion reactions. The initial binding rates were obtained from the slopes of lines in plots of -ln (1 - C) versus time t, where C is the fraction of DNA fragments bound to PNA. (C) Dependence of PNA1 association on ionic strength. Plot of initial binding rates of PNA1 to the PM target as a function of NaCl concentration. The line is drawn to guide the eye.

