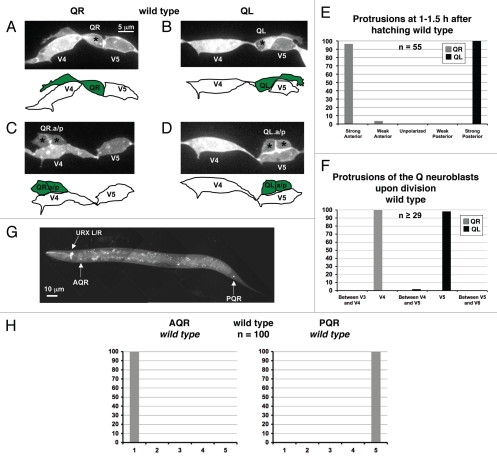
Figure 1.
Protrusions and migrations of the Q neuroblasts and migrations of the AQR and PQR neurons in wild-type animals. (A–D) Confocal fluorescent micrographs of Q neuroblasts in wild-type L1 larvae visualized with scm::gfp::caax expression. Asterisks mark the position of the Q neuroblasts and the Q neuroblast descendants. Tracings of the Q neuroblasts and the Q neuroblast descendants are located beneath each micrograph. The scale bar in (A) represents 5 µm for (A–D). (A) A QR neuroblast polarizes, sending out protrusions anteriorly over the V4R seam cell at 1–1.5 h after hatching. (B) A QL neuroblast polarizes, sending out protrusions posteriorly over the V5L seam cell at 1–1.5 h after hatching. (C) A QR neuroblast divides over the V4R seam cell after migrating anteriorly at 4–4.5 h after hatching. (D) AQL neuroblast divides over the V5L seam cell after migrating posteriorly at 4–4.5 h after hatching. (E) Quantitation of the direction and extent of protrusions during the polarization stage of the Q neuroblasts at 1–1.5 h after hatching in wild-type animals. The x-axis represents the direction and extent of protrusion of the Q neuroblasts. The y-axis represents the percentage of Q neuroblasts protrusions in each of the categories along the x-axis. For both QR and QL protrusions, n = 55. (F) Quantitation of the location of the Q neuroblasts at division with respect to the adjacent seam cells in wild-type animals. The x-axis represents the location of the Q neuroblasts at division with respect to the adjacent seam cells. The y-axis represents the percentage of Q neuroblasts located at those positions. For both QR and QL migrations, n ≥ 29. (G) Epifluorescent micrograph of the AQR and PQR neurons in a wild-type L4 larvae visualized with Pgcy-32::gfp. The scale bar in (G) represents 10 µm. (H) Quantitation of the final migratory positions of the AQR and PQR neurons in wild-type animals. The x-axis represents the final position of the AQR and PQR neurons along the anterior-posterior axis of the animal as described in the Materials and Methods section. The y-axis represents the percentage of AQR and PQR neurons located at those positions along the anterior-posterior axis. See Materials and Methods for scoring criteria. For both cases, n = 100.

