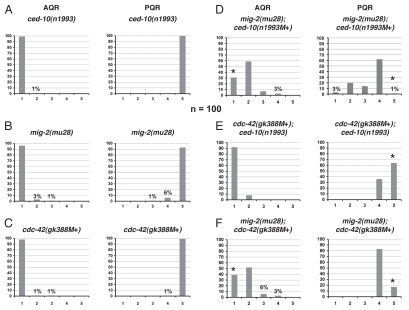
Figure 6.
AQR and PQR, Q neuroblast descendants, migration defects in mutants. (A–F) Quantitation of the final migratory positions of the AQR and PQR neurons. The graphs are organized as described in Figure 1H and Materials and Methods. The asterisks in (D–F) represent statistically significant differences for the double mutants as compared to the combination of the defects observed in the two single mutants. For all cases, n = 100.

