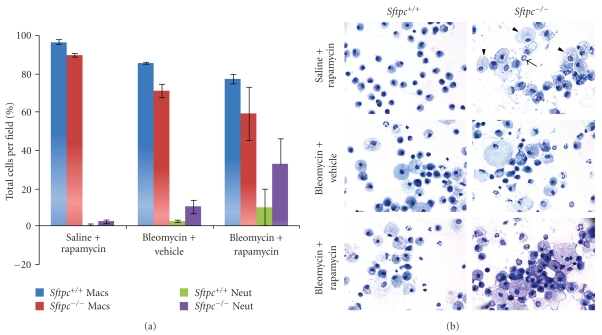
Figure 2.
Differential cell counts and morphology of inflammatory cells found in BALF. (a) Macrophages and neutrophils were counted and expressed as a percentage of the total cells counted from cytospin preparations. (b) Representative images of cytospin preparations of BALF cells are shown. Arrowheads identify enlarged foamy macrophages while the arrow indicates a neutrophil for comparison of inflammatory changes among the experimental groups. All images were photographed at 60x magnification.

