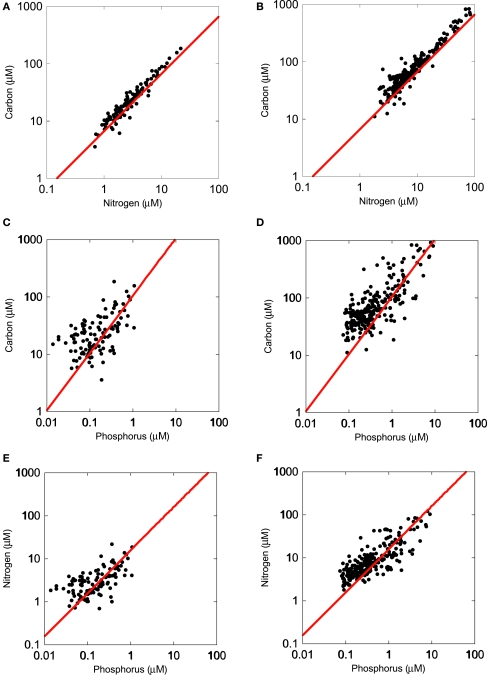
Figure 1.
Regressions (SMA) of organic carbon, nitrogen, and phosphorus content in the <1 μm size-fraction [left panels (A,C,E)] and <80 μm seston [(right panels (B,D,F)]. Samples were collected in >120 lakes in the Upper Midwest (MN, IA, SD, MI). The red line represents the Redfield ratio of these elements.

