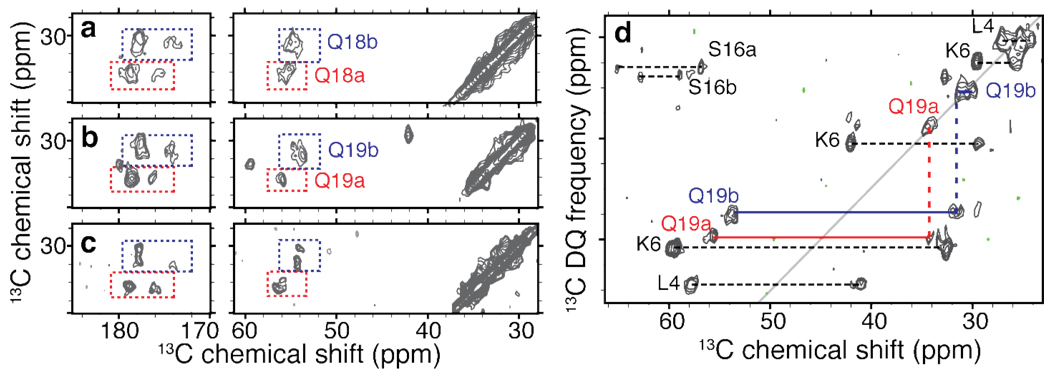
Figure 4.
Doubling and similarity of glutamine resonances. (a,b) 2D 13C-13C DARR spectral regions highlighting the Gln18 and Gln19 resonances in httNTQ30P10K2 samples p2 and p3. For each residue we observe two distinct sets of resonances, marked as ‘a’ (red) and ‘b’ (blue). The cross-peak patterns suggest nearly identical chemical shifts for the Cβ and Cγ sites in each case. Panel (c) shows the virtually identical chemical shifts of a singly labeled glutamine within K2Q30K2 fibrils (U-13C,15N-Gln6 - the fourth residue within the polyQ). (d) 2D 13C-13C SQ-DQ spectrum for sample p3 (using 1.5 ms SPC53 mixing at 12kHz MAS and ω0,H/2π=600 MHz), showing analogously color-coded Gln19 cross peaks. Doubling appears specific to the β-sheet structure: singular sets of resonances are observed for helical residues (e.g. Leu4), doubling can also be seen for Ser16.

