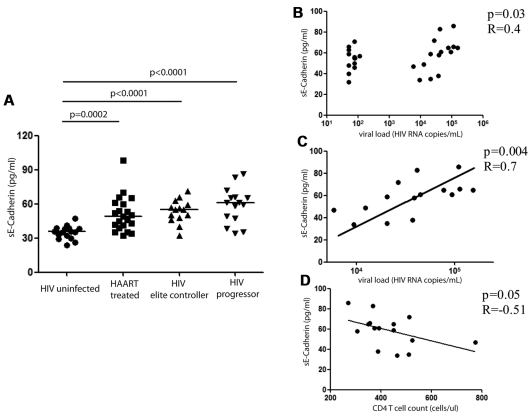
Figure 3.
sE-cadherin levels in different stages of HIV-1 infection. The levels of sE-cadherin in the plasma were assessed by ELISA and are reported (in pg/mL). sE-cadherin levels were compared in HIV-negative subjects (n = 16), HIV-positive subjects on ART (n = 21), elite controllers (n = 14), and subjects with chronic-progressive HIV-1 infection (“progressors”; n = 15). sE-cadherin levels were significantly higher in all HIV-1 infected subjects compared with HIV-1 negative subjects (ART, P = .0002; elite controllers and progressors, P < .0001) with the levels highest in subjects with chronic-progressive disease and lowest in subjects on ART. The horizontal lines at each variable indicate the mean (A). However, differences among subjects with HIV-1 infection were not statistically significant. We observed a strong correlation of sE-cadherin levels and viral load among the subjects with chronic HIV-1 infection (B; P = .004, R = 0.7) and a negative association of CD4+ T-cell count (in cells/mL) and sE-cadherin plasma levels (C). This correlation, however, did not reach statistical significance (P = .05, R = −0.51).

