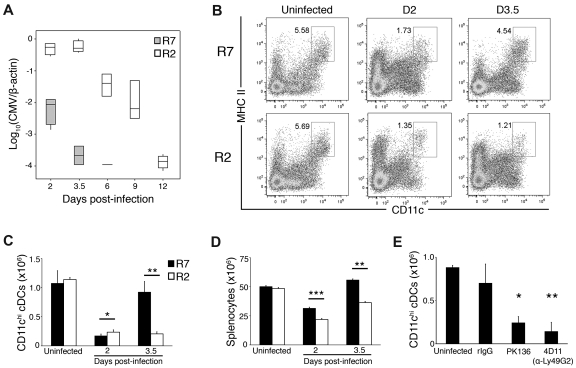
Figure 1.
Ly49G+ NK cells in MHC I Dk mice promote recovery of cDCs after MCMV infection. (A) Median MCMV genome values for spleens of R7 and R2 congenic mice at the indicated times after infection. (B-D) Control and MCMV-infected R7 and R2 splenocytes were stained for CD3, CD19, MHC class II, and CD11c and analyzed by flow cytometry. (B) Representative dot plots showing the proportion of CD11chi, MHC II+ cDCs in uninfected and infected R7 and R2 mice. The dot plots were gated on live CD3−, CD19− cells (C) The graph represents the mean ± SEM for live gated cDCs in R7 and R2. (D) The graph represents the mean ± SEM for total splenocytes in R7 and R2. (A-D) Data are representative of 5 experiments with 3-4 mice per strain per time point (*P < .01, **P < .005, ***P < .0005 strain comparison at the indicated time point by Student t test). (E) The graph represents the mean ± SEM for live gated cDCs in R7, NK cell–depleted R7 (PK136) and Ly49G2+ NK cell–depleted (4D11) mice on day 3.5 after infection. Data are representative of 2 experiments with 4 to 6 mice per treatment group (*P < .01, **P < .005 by Student t test compared with rat IgG treated, no significant difference between uninfected and rIgG treated).

