Figure 4.
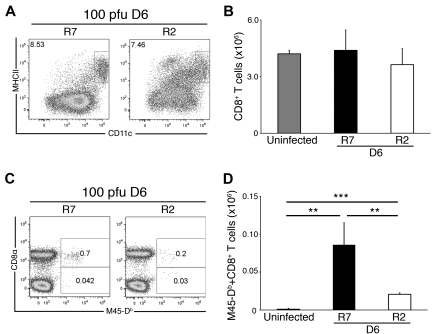
CD8 T-cell priming defect in susceptible mice without MHC I Dk. Ex vivo splenocytes isolated from MCMV-infected (100 PFU) R2 and R7 mice were stained and analyzed for cDCs as described in Figure 1. Data are representative of 2 experiments with 3-4 mice per genotype. (A) Representative dot plots showing the proportion of CD11chi, MHC II+ cDCs in day 6–infected R2 and R7 spleens. The dot plots were gated as described for Figure 1. (B) The graph represents the mean ± SEM for live gated CD8+ T cells (CD19−, CD3+) in uninfected and day 6–infected R7 and R2 spleens. (C) Representative dot plots showing the proportion of M45-Db–specific CD8 T cells in day 6–infected R7 and R2 spleens. The dot plots were gated on CD19−, CD3+ cells. (D) The graph represents the mean ± SEM for virus-specific CD8 T cells in uninfected and day 6–infected R7 and R2 spleens. The data are representative of 2 experiments with 4 mice per strain per time point (**P < .01, ***P < .0001 by Student t test).

