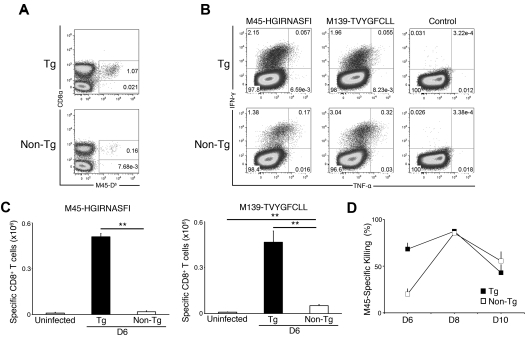
Figure 6.
MHC I Dk NK-cell virus resistance defines MCMV-specific CD8 T-cell effector response. Tg-Dk and non-Tg splenocytes were stained for flow cytometric analysis as described in Figure 3. (A) Representative dot plots showing the proportion of M45-Db–specific CD8 T cells in day 6–infected spleens. The dot plots were gated on CD19−, CD3+ cells. Data are representative of 4 experiments with 4 mice per strain per time point. (B) Representative dot plots showing the proportion of cytokine responsive CD8 T cells after peptide restimulation of splenocytes. The dot plots were gated on CD19−, CD3+, CD8+ cells. (C) The graph represents the mean ± SEM for cytokine producing M45-Db– and M139-Kb–specific CD8 T cells in uninfected and day 6–infected Tg-Dk and non-Tg spleens. Data are representative of 2 experiments with 4 mice per strain per time point (**P < .0005 by Student t test). (D) A 4-hour in vivo CTL assay was performed with M45 peptide-pulsed and unpulsed control targets. The graph represents the mean ± SEM for in vivo virus-specific CTL activity at the indicated times after infection. Virus-specific CTL activity in spleen was significantly enhanced in Tg-Dk compared with non-Tg on day 6 postinfection (P < .01). Data are representative of 2 experiments with 4 mice per strain per time point.

