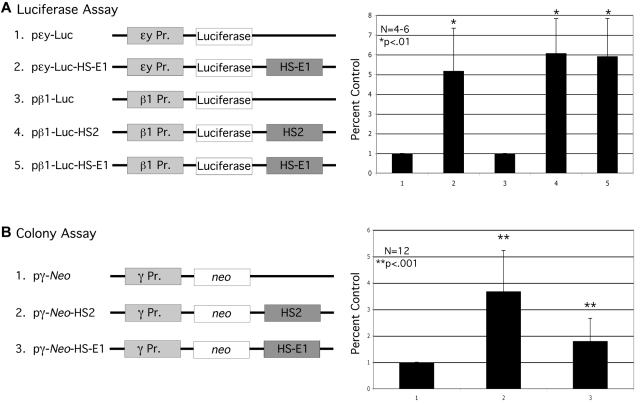
Figure 2.
Assays for enhancer function of HS-E1. (A) Transient reporter assay. Reporter constructs used in the transient assay are illustrated at the left. The bar graph shows relative levels of luciferase activity measured using the indicated constructs. (B) Colony assay. The selectable marker constructs used in the colony assay are illustrated to the left. The bar graph shows colony numbers obtained using the indicated constructs, with the average colony number for pγneo normalized to 1.0. Each bar in the graph represents the average of 12 replicates of the experiment. All error bars represent standard error of the mean.

