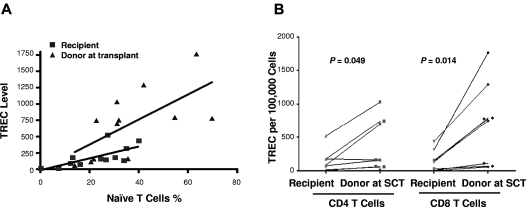
Figure 2.
TREC analysis for thymic function. (A) Correlation between the naive CD4+ and CD8+ T-cell numbers and TREC levels of recipients (■) and donors (▴) at transplant, with lower TREC levels in the recipients (r = 0.69, P = .01) than that in the donors (r = 0.65, P = .02). (B) TREC levels of CD4+ and CD8+ T cells of recipients and donors at transplant (8 pairs).

