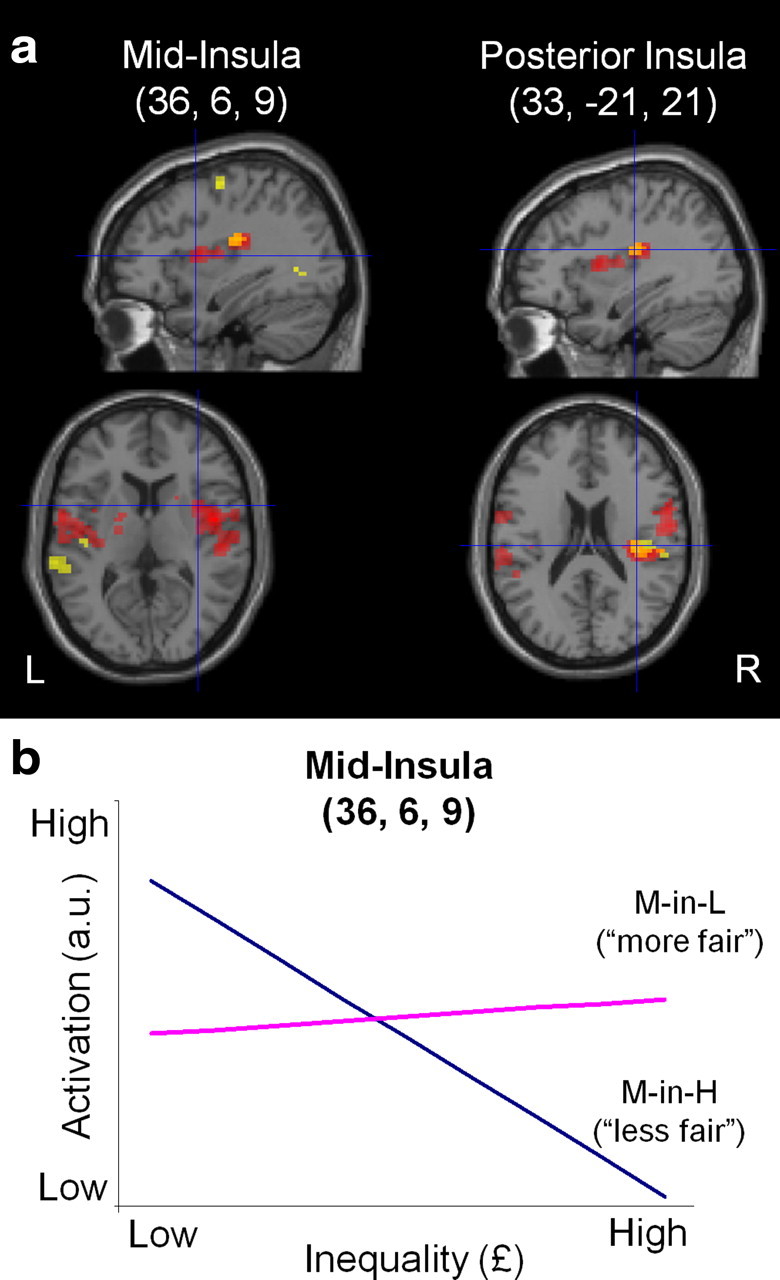
Figure 5.

Neural responses to inequality and its interaction with social context in insular cortex. a, Sections showing activation related to processing of inequality in the insula. In yellow, we show that posterior insula is negatively correlated with inequality when collapsed across all trials (L, M-in-L, M-alone, M-in-H, H). In red are shown areas of differential activity in mid- and posterior insula when contrasting responses to inequality in the more fair (M-in-L) versus the less fair (M-in-H) context. Areas of overlap are shown in orange. The right column is at the peak of activation for the negative correlation, and the left column shows slices at the peak for the interaction. The activations including these peaks survive whole-brain cluster-level correction (p < 0.05 FWE corrected; threshold of p < 0.005 used to define the clusters) and are displayed at p < 0.005 (uncorrected, 10 voxel threshold). b, Visualization of the effects driving the interaction of inequality with social context at the peak voxel in mid-insula (x = 36, y = 6, z = 9). The slope of the regression line for activation (in arbitrary units) against inequality (£) is shown for each social context (M-in-H and M-in-L). The difference in slopes illustrates that inequality modulates insula activity only when offers are viewed more aversively (M-in-H). The slope of each regression line is the parameter estimate (β) for each condition obtained from the general linear model used to analyze the fMRI data, averaged across subjects (mean ± SEM β value: M-in-H, −2.92 ± 0.64; M-in-L, 0.32 ± 0.63).
