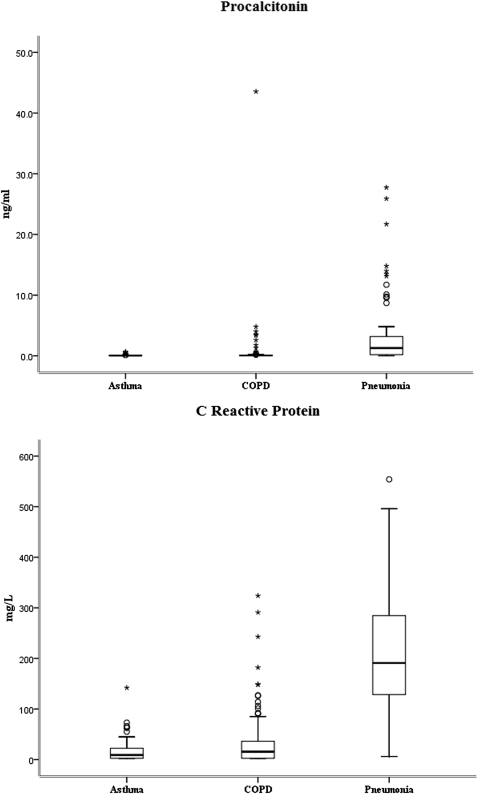
Figure 2.
Box and whisker plots for patients admitted with exacerbation of asthma, COPD, and pneumonia for the biomarkers procalcitonin and C-reactive protein. The horizontal bar represents the median; the box length represents the interquartile range. Outliers are identified by ○ (1.5 × the interquartile range) and * (3 × the interquartile range).

