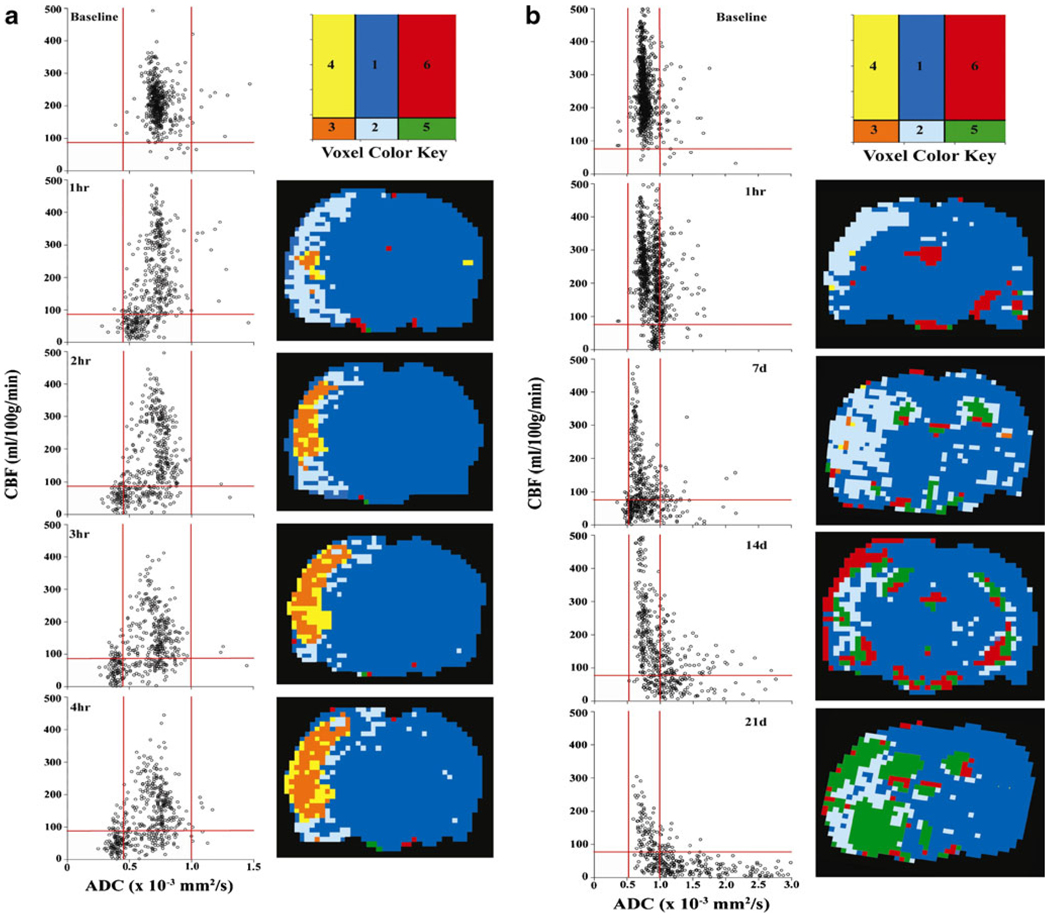
Fig. 2.
Representative quantitative CBF versus ADC voxel plots in a rat before and during pMCAO for up to 4H (a) and 21D (b). The ischemic transition compartments are 1 = normal ADC, CBF; 2 = penumbra, low CBF, normal ADC; 3=core, low CBF, low ADC; 4=high-flow infarction, low ADC, normal–high CBF; 5=ischemic necrosis and dissolution, high ADC, low CBF; and 6 = unidentified. Red lines represent upper and lower bounds (mean ± 2SD) of ADC and the lower threshold of CBF (−2SD)

