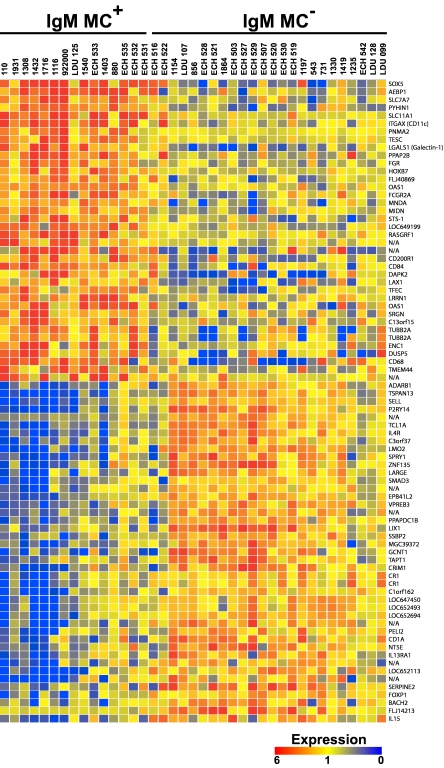
Figure 1.
Transcriptome analysis of IgM+κ+CD27+ B cells. The transcripts differentially expressed by IgM+κ+CD27+ B cells from HCV+MC+ and MC− patients are displayed. Up- and down-regulated transcripts are indicated in red and blue, respectively. The magnitude of expression is indicated by the color bar.

