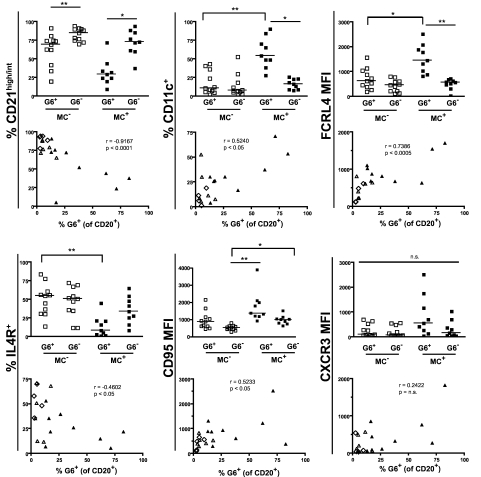
Figure 4.
Immunophenotypic profiles of MC+ and MC− patients' G6+, G6−, and total B cells. Data are flow cytometric analyses of PBMCs from HCV+MC+ (n = 9) and MC− (n = 11; SVR = 2, HCV Ab− = 2, HCV RNA+ = 6) subjects. Cell surface marker expression in each subject's G6+ and G6− B cells is shown in the column graphs. The scatterplots represent expression of cell surface markers versus the proportion of total B cells that are G6+. In the scatterplots: ▴ represents MC+ patients; ▵, HCV RNA+ patients; and ◊, HCV RNA− patients. MFI indicates geometric mean fluorescence intensity. The P values for the column graphs were determined using the Kruskal-Wallis and Dunn multiple comparison tests. *P < .05. **P < .01. n.s. indicates not significant (P > .05). Black bars represent medians. For the scatterplots, R was calculated using the Spearman correlation coefficient.

